I was going through the “Road to Solo Driving handbook” yesterday. Having a dominant left brain, I couldn’t resist noticing the statistics, numbers and charts in the book. However, it was on page 33 that a particular chart caught my attention.
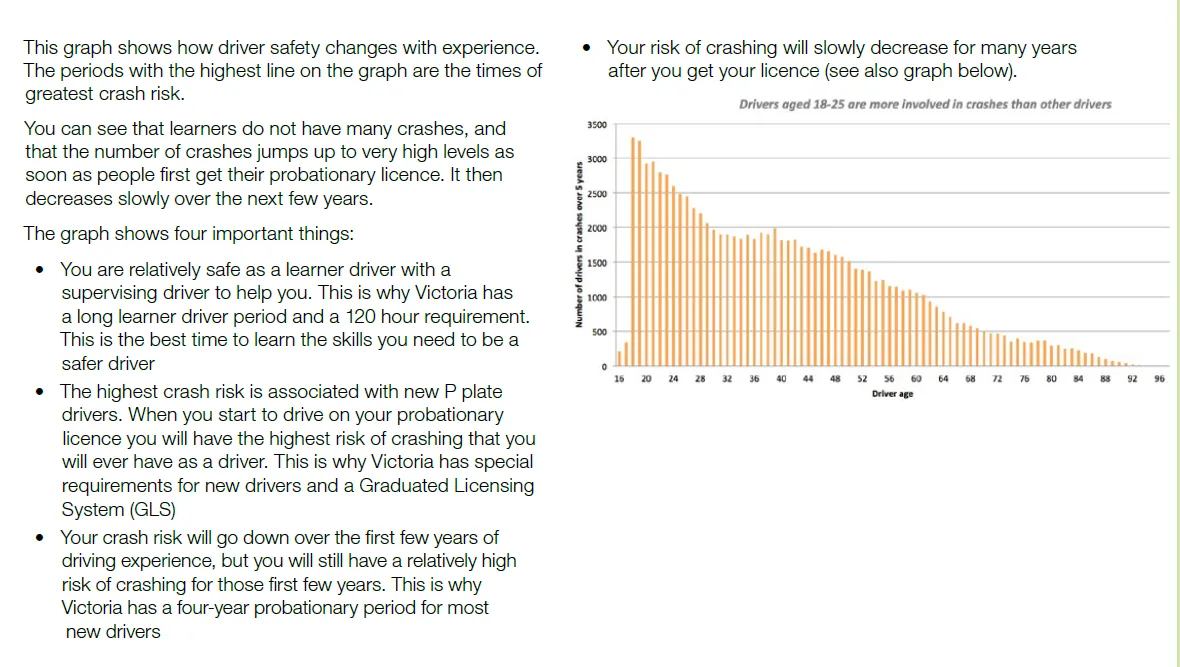
Figure 1
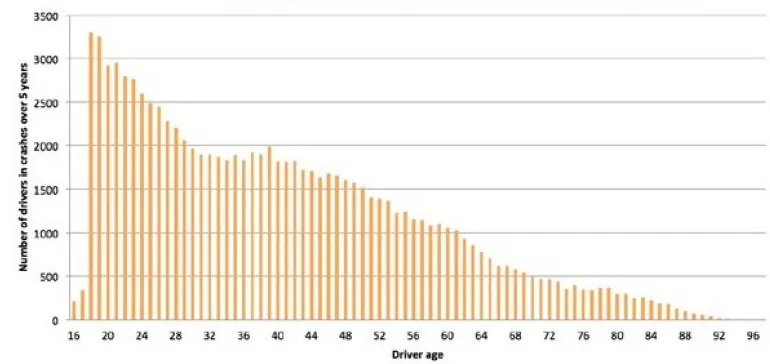
The chart was attempting to prove that driver safety improves with experience. While that might sound plausible, I found myself having a good-natured disagreement with the graph for two specific reasons:
- Age doesn’t necessarily equate to driving experience.
- The denominator used in the index across age groups was far from consistent.
Why?
In my view, the information in this graph in the “Road to Solo Driving Handbook” doesn’t provide conclusive evidence to prove that driver safety improves with experience.
Firstly, the graph tries to show “how driver safety changes with experience” not “age”. Hence, the chart should have used the “Number of years after obtaining a driving license” instead of “Age”. For instance, if someone obtains their license at the age of 35, they would fall into the 35-36 age bracket, despite having less than a year of experience. So if this driver meets with an accident, in the chart, it will show as if an experienced driver met with an accident. The chart assumes that everyone gets their license between the ages of 16 and 20, which, as we know, isn’t always the case.
Secondly, even if the graph was trying to use age as a proxy for driving experience, the denominator of the index across age groups is not uniform. ie. It should have used “% of drivers in crashes” or “No. of drivers in crashes per 100 drivers”. In Figure 2, I use an extreme example to show how it could drive the wrong message.
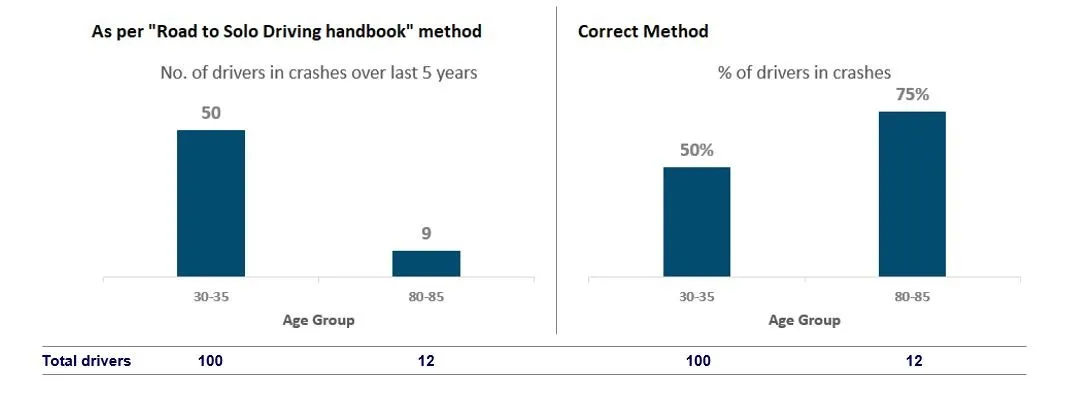
Figure 2
Moreover, the key insights the chart tries to derive are:
- You are a relatively safe driver as a learner driver. However, Learner drivers could be in any age bracket.
- The highest crash risk is associated with new P-plate drivers. However, there is no age limit for P-plate drivers. For example, even in the 18 age bracket with the highest count, there could be a higher proportion of learner drivers.
- Your crash risk goes down over the first few years of driving experience. However, as highlighted in my main arguments, this needs to be validated.
- Your risk of crashing will slowly decrease for many years after you get your license. However, as highlighted in my main arguments, this needs to be validated.
This sparked my interest to validate this.
There is sufficient research evidence (Figure 3) to prove that key personality traits that can be directly correlated with driving safety improve with age. E.g. Age Differences in the Big Five Across the Life Span: Evidence from Two National Samples by Brent W. Roberts and Daniel Mroczek.
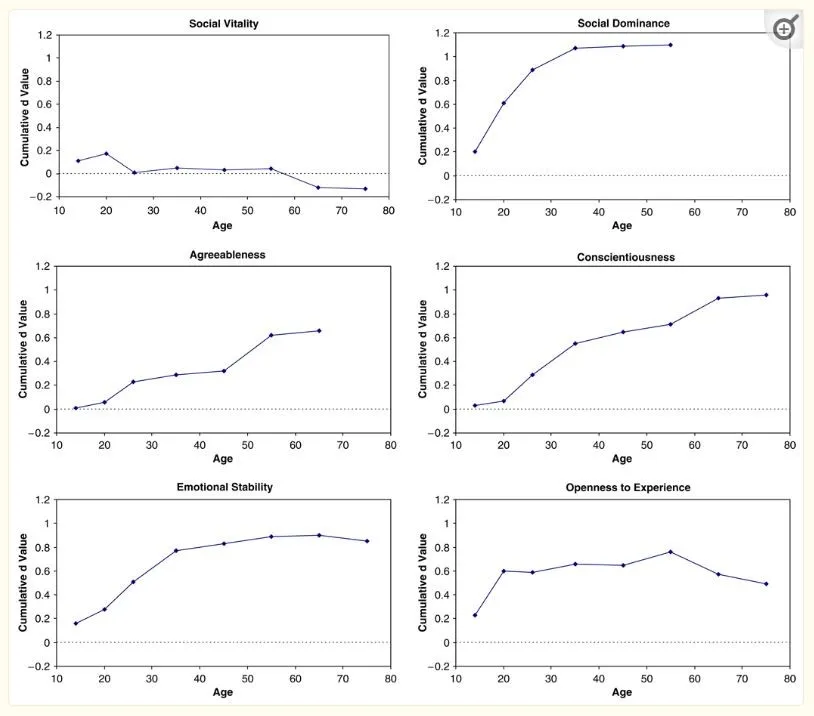
Figure 3
The question is “Does the crash risk decrease with drivers’ age?” This was a classic deduction/estimation problem. The method that I followed and the results I derived are as follows.
I needed to find the number of drivers in crashes per 100 drivers, in each age group. I already had the “number of drivers in crashes” in each “age group” from the Vic Roads “Road to Solo Driving Handbook”. If I know the total number of drivers in each age group, my work is done.
1. First, I gathered the population in Victoria in each age bracket from the Australian Bureau of Statistics website.
2. I could find some statistics on “% of people driving” in each age group, done by Roy Morgan. (Figure 4)
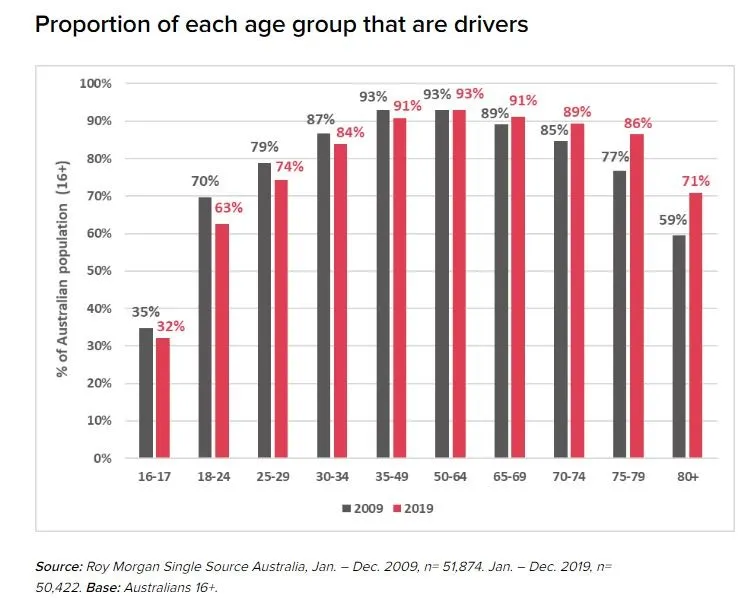
Figure 4
3. Then, I manually typed the information on the “number of drivers in crashes” in each “age group” from the Vic Roads handbook.
Now I finally have the below table. (Figure 5)
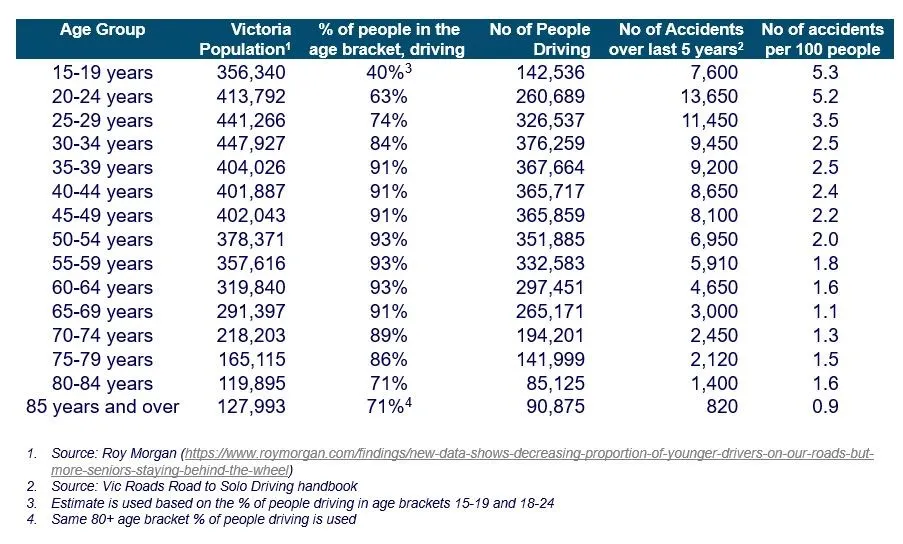
Figure 5
Then I drew my own graph and compared it with the VIC roads graph. (Figure 6)
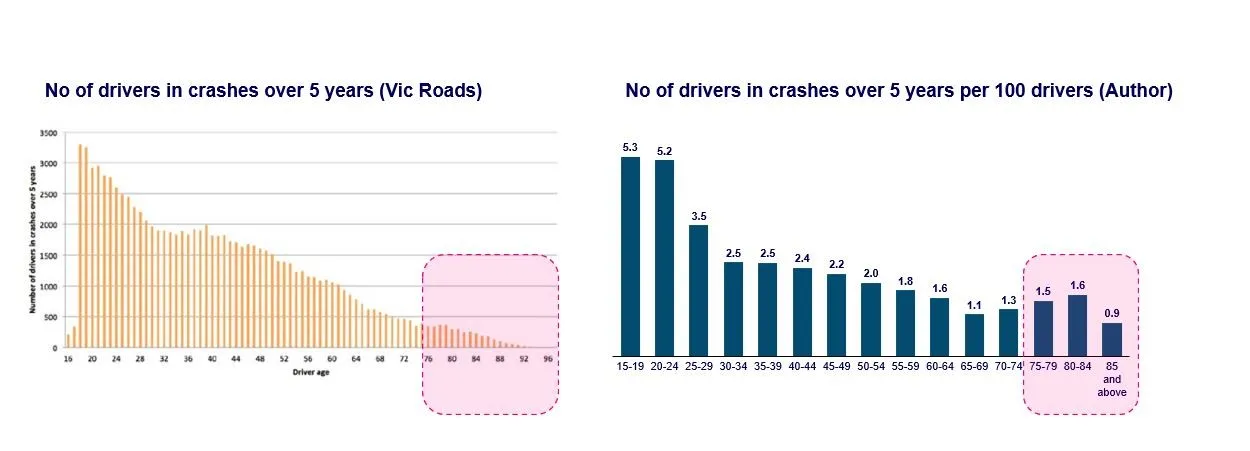
Figure 6
The findings were:
- Mostly, the Vic Roads graph holds, though it has not used the most optimal metric.
- In contrast to the Vic Roads analysis, the 80+ age group has a slightly higher risk of a crash than the 60-70 age group.
- Most importantly, there is something inherently wrong with me, I chose to conduct this analysis on a long weekend while most normal people were off on their delightful adventures.
First published on LinkedIn.