Working on a project that requires presenting complex financial data to an audience is a very common day-to-day task that most analysts come across. The ability to communicate complex information in a concise and clear manner is essential to an analyst’s success. However, this area doesn’t get as much attention from analysts as the analysis and insight generation process. However, from an outcome point of view, the presentation is equally important as the analysis or insights. Because the extent to which decision-makers understand and remember the data will depend on the quality of the analyst’s presentation. This is an area in which large consultancy firms excel.
I was fortunate to have the opportunity to work with some of the large consultancy firms, such as Deloitte Monitor, McKinsey, Delta Partners, etc., at a very early stage in my career. I was always amazed by the quality of their presentations and especially the way they present the data by way of charts and designs. One principle that is consistently visible in most of these visualizations is the higher “Data-Ink Ratio”. Simply put, removing all non-value-adding elements from the visualization to improve the focus on the key message.
What is Data-Ink Ratio?
This term was introduced by Edward Tufte in his book “The Visual Display of Quantitative Data.” He defined the Data-Ink Ratio as the ratio between the amount of ink or pixels used to present relevant information versus the amount used for other purposes, such as decorations or non-data elements.

Importance of Data-Ink Ratio
A high data-ink ratio allows the audience to focus on the data rather than unnecessary elements that do not contribute to the message. When there is a high data-ink ratio, the data is presented in a clear and concise manner, making it easier for the audience to understand and interpret the information. In addition, high data-ink ratio visuals are more aesthetically pleasing and professional-looking.
How to Achieve a High Data-ink Ratio:
1. Simplify the design: Avoid using unnecessary decorations, 3-D effects, gradients, or other special effects that do not add value to the visualization.
2. Use appropriate chart types: Choose chart types that are appropriate for the data being presented. For example, use a line chart to show trends over time, a bar chart to compare values between different categories, and a scatter plot to show relationships between variables.
3. Erase redundant data ink: We should also delete the elements that show redundant data from the visualization. Eg. Having the legend when the category labels already show the category names.
4. Use clear labels: Labels should be clear, concise, and informative. Use labels that help the audience understand the data being presented. And remove unnecessary labels.
5. Minimize the use of color: Color can be a powerful tool for highlighting data points, but it can also be distracting if used excessively. Stick to a simple color palette and use it consistently throughout the presentation.
6. Avoid clutter: Cluttered visuals can make it difficult for the audience to focus on the data. Use white space to separate elements and create a clean, organized look.
7. Use appropriate font sizes: Use font sizes that are appropriate for the size of the visualization and the audience. Avoid using fonts that are too small or too large, as they can be difficult to read.
8. Highlight key data points: Use data to tell a story and make a point. The data should support the main message of the presentation and be presented in a logical and clear manner.
Below is an example where I simulated improving a chart using the above principles. I used a very simple data set of “Top 5 countries by population”. And to elaborate certain points, I have used slightly exaggerated examples.
Let’s work with the below graph.
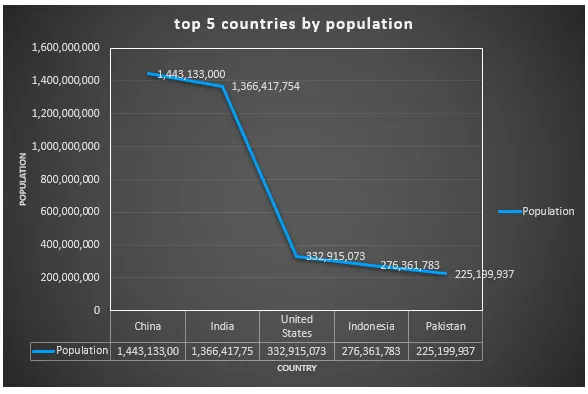
- Use the appropriate chart type: This data shows category information. A bar chart will be more appropriate.
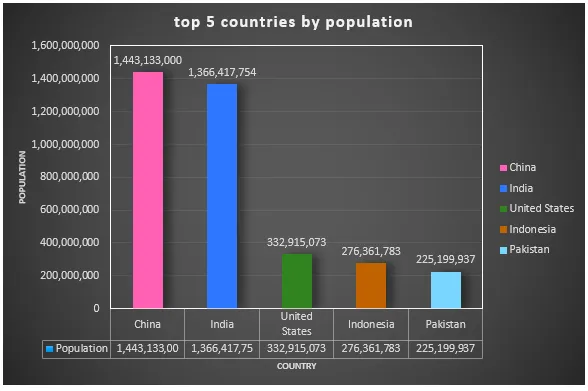
2. Remove backgrounds and gradients: the black background and the circular gradient take the attention of the viewer away from the data.
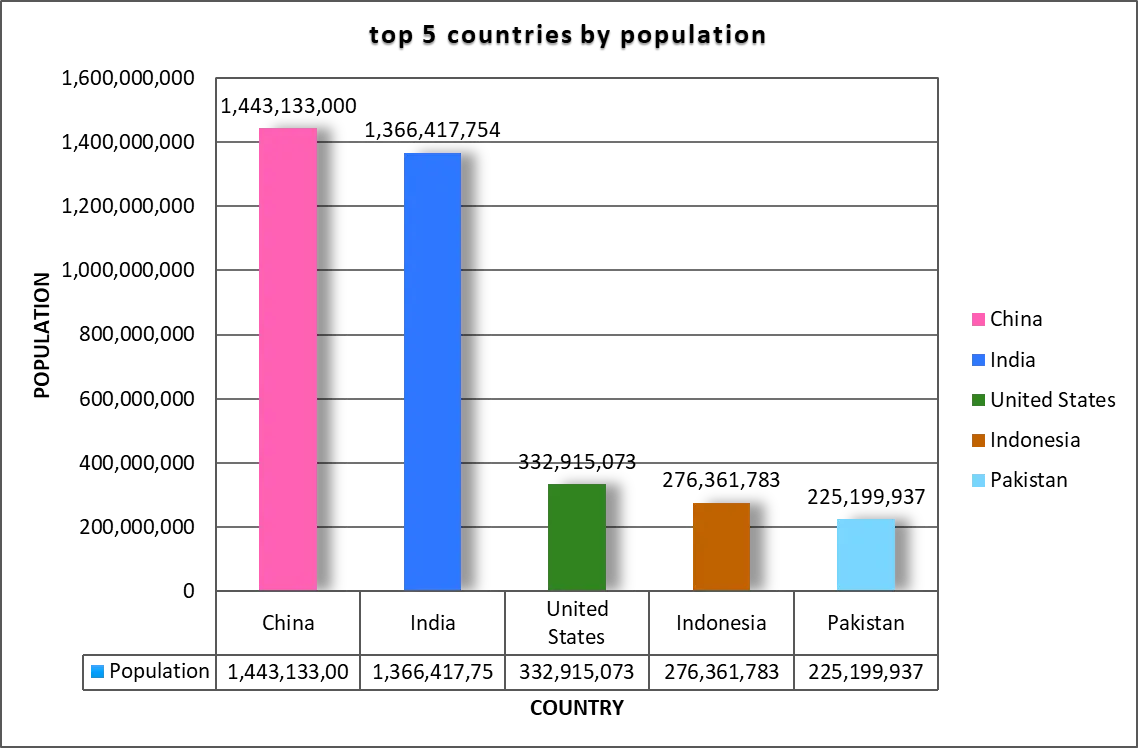
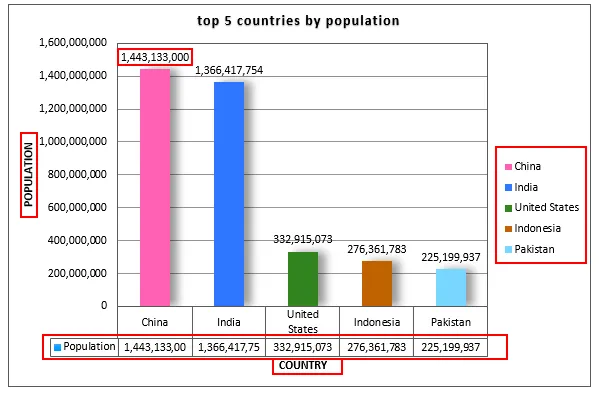
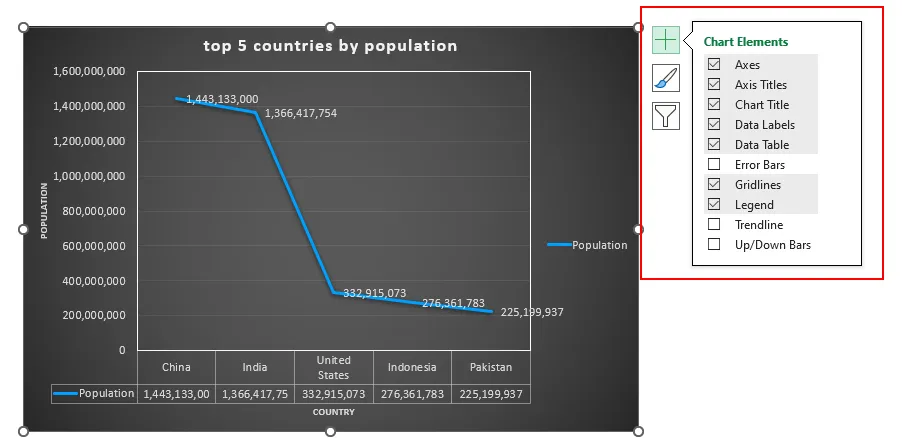
3. Remove borders and redundant data: In this example the axis labels, legend, the data table below the graph are redundant information. The elements highlighted below don’t add incremental value to the graph.
This is the graph after removing them.
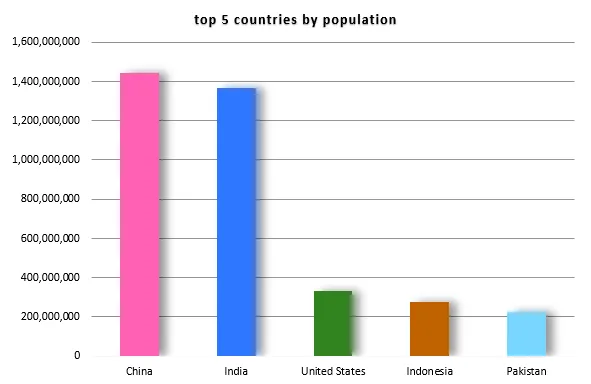
4. Remove effects and minimize the use of color: We can remove 3D effects, shadows and multiple colors.
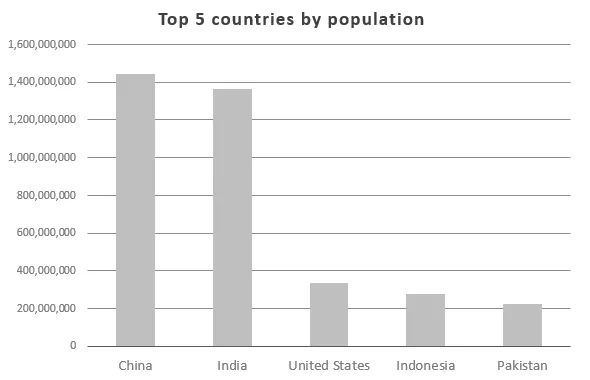
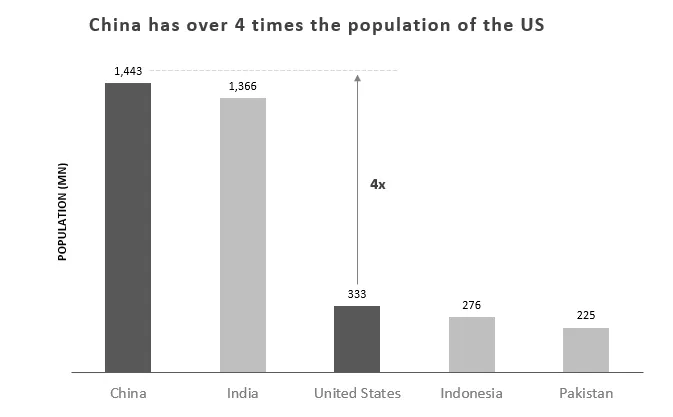
5. Remove grid lines and add data tables: If we bring in the data labels on top of the bars, we can remove the grid lines. This will also enable the viewer to read the data easily. At the same time, we can show the data in millions to improve readability.
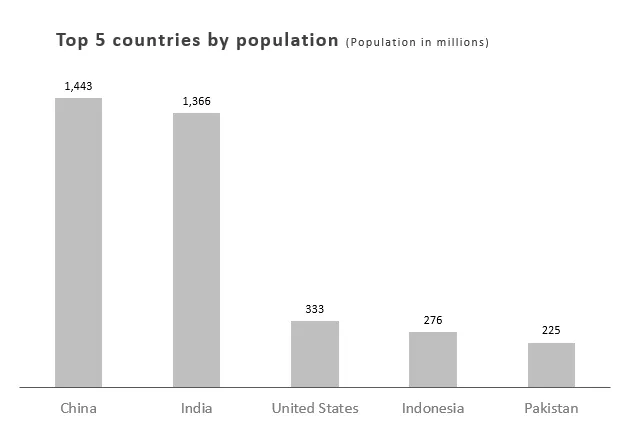
Now if we compare the two graphs before and after, we can see the difference.
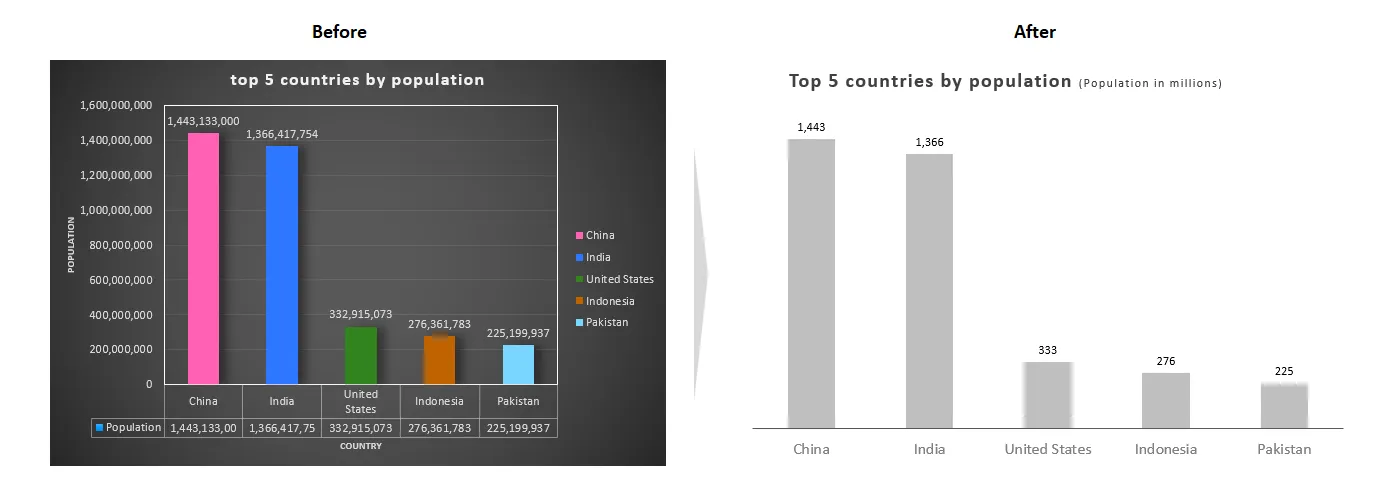
6. Highlight key data points: In addition you can use the graph to convey your key message.
If you are using excel to create the charts, you can achieve the above using
1. “Chart Elements” section of the graph,
2. “Chart Design” and “Format” sections of the ribbon

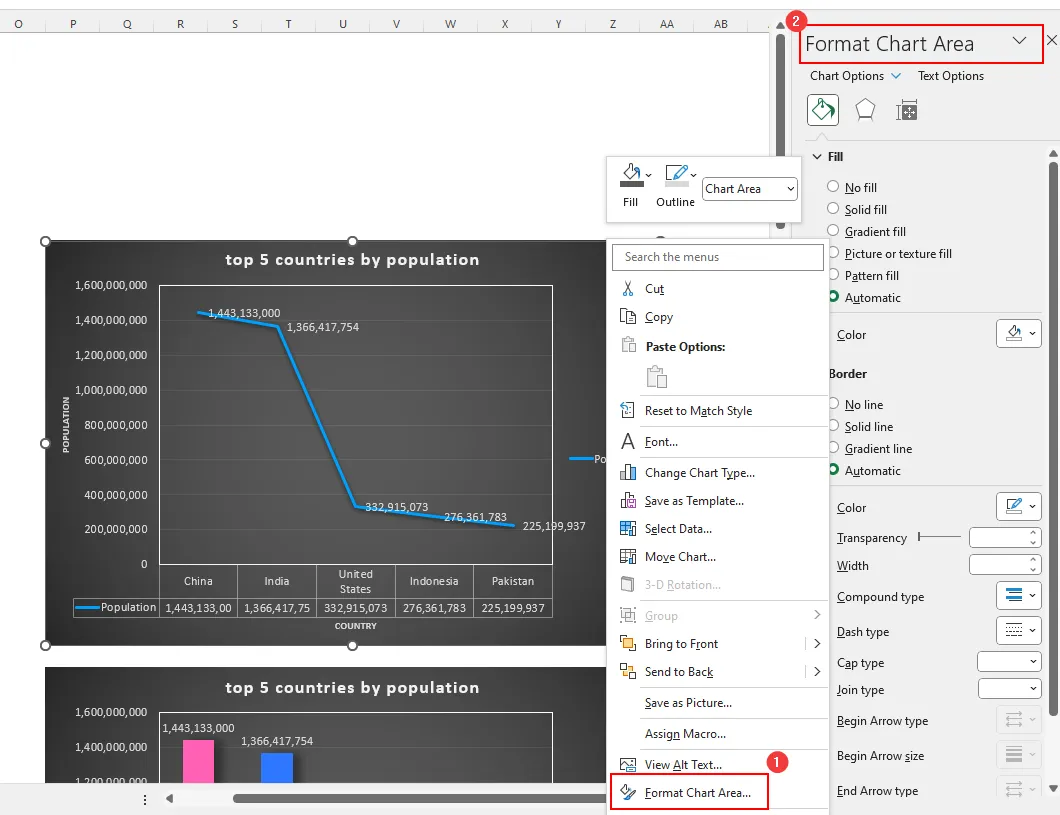
3. “Format Chart Area” Section
Conclusion
A high data-ink ratio can improve the effectiveness of data visualizations and presentations. However, it is important to maintain a balance between minimalism and effectiveness.
First published on LinkedIn.